|
|

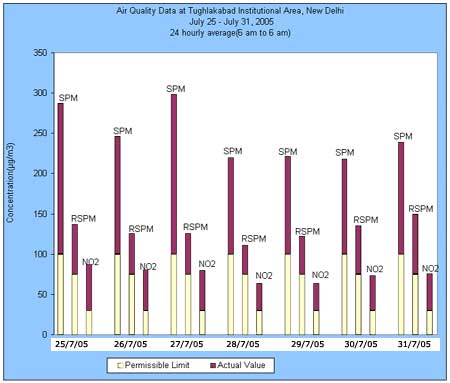
July 25 TO July 31, 2005
Parameters
Date |
Suspended
Particulate matter
(mg/m3) |
Respirable
Suspended Particulate
Matter (mg/m3) |
Sulfur
dioxide
(mg/m3) |
Nitrogen
dioxide
(mg/m3) |
Maximum*
Permissible limit (mg/m3) |
100 |
75 |
30 |
30 |
25/7/05 |
187.34 |
61.45 |
4.25 |
56.91 |
26/7/05 |
145.82 |
50.16 |
3.99 |
50.07 |
27/7/05 |
198.87 |
50.53 |
4.03 |
49.52 |
28/7/05 |
119.54 |
36.31 |
3.27 |
33.79 |
29/7/05 |
121.24 |
47.26 |
4.16 |
33.93 |
30/7/05 |
118.24 |
60.21 |
4.77 |
43.22 |
31/7/05 |
138.80 |
74.85 |
5 |
46 |
*Tughlakabad has been considered as sensitive area as Batra hospital is in close vicinity.
NM: Not measured due to unavoidable reasons. |
 |
| |
Actual value |
| |
Permissible limit |
|
*Tughlakabad has been considered
as sensitive area as Batra hospital is in close vicinity.
DATE |
AQI |
DESCRIPTION |
COLOR |
| 25/7/05 |
187.34 |
Unhealthy |
|
| 26/7/05 |
145.82 |
Unhealthy |
|
| 27/7/05 |
198.87 |
Unhealthy |
|
| 28/7/05 |
119.54 |
Unhealthy |
|
| 29/7/05 |
121.24 |
Unhealthy |
|
| 30/7/05 |
118.24 |
Unhealthy |
|
| 31/7/05 |
138.80 |
Unhealthy |
|
AQI
INDEX |
| INDEX VALUE |
DESCRIPTION |
COLOUR |
| 0-50 |
Good |
Green |
| 51-100 |
Marginal (Moderate) |
Yellow |
| 101-200 |
Unhealthy (Poor) |
Orange |
| 201-300 |
Very Unhealthy (Very Poor) |
Red |
| 301+ |
Critical |
Purple |
*What is
AQI? |