|
|
|
 |
|
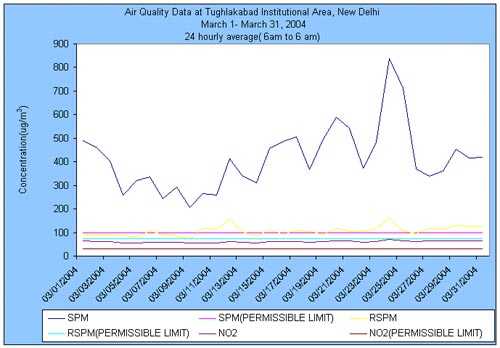
AMBIENT
AIR QUALITY DATA (AQI) AT TUGHLAKABAD INSTITUTIONAL AREA |
Air
Quality for the Month of March, 2004
|
Parameters
Date |
Suspended
Particulate Matter (mg/m3) |
Respirable
Suspended Particulate
Matter (mg/m3) |
Sulphur dioxide
(mg/m3) |
Nitrogen
dioxide
(mg/m3) |
Maximum *
Permissible limit (mg/m3) |
100 |
75 |
30 |
30 |
01/3/04 |
491.56 |
91.63 |
7.2 |
63.70 |
02/3/04 |
459.75 |
89.12 |
7.1 |
63 |
03/3/04 |
402.43 |
90.01 |
6.8 |
62.7 |
04/3/04 |
257.79 |
85.71 |
5.9 |
56.4 |
05/3/04 |
321.08 |
83.43 |
5.8 |
57 |
06/3/04 |
337.44 |
103.28 |
6.1 |
59 |
07/3/04 |
244.78 |
91.38 |
6 |
58.4 |
08/3/04 |
291.64 |
84.84 |
5.6 |
57.7 |
09/3/04 |
205.67 |
71.78 |
5 |
54 |
10/3/04 |
264.43 |
117.63 |
5.8 |
57 |
11/3/04 |
260.18 |
115.44 |
5.3 |
56 |
12/3/04 |
412.72 |
157.97 |
6.4 |
62 |
13/3/04 |
339.89 |
101.3 |
5.9 |
60 |
14/3/04 |
310.58 |
86.84 |
5.3 |
57 |
15/3/04 |
455.34 |
109.88 |
6 |
61.4 |
16/3/04 |
487.56 |
91.96 |
6.7 |
61.9 |
17/3/04 |
504.72 |
108.42 |
7.1 |
63 |
18/3/04 |
366.78 |
103.51 |
6.4 |
60 |
19/3/04 |
496.03 |
91.93 |
7 |
63 |
20/3/04 |
587.76 |
118.32 |
7.2 |
64 |
21/3/04 |
541.38 |
106.26 |
6.8 |
63.4 |
22/3/04 |
372.19 |
104.07 |
6 |
59 |
23/3/04 |
484.19 |
116.2 |
6.6 |
62 |
24/3/04 |
838.81 |
160.96 |
8 |
70 |
25/3/04 |
710.80 |
105.82 |
7.2 |
66 |
26/3/04 |
368.79 |
96.93 |
6.9 |
63 |
27/3/04 |
338.11 |
117.30 |
7 |
64 |
28/3/04 |
359.27 |
113.91 |
7 |
63.6 |
29/3/04 |
454.30 |
129.54 |
7.6 |
65 |
30/3/04 |
417.57 |
127.46 |
7.1 |
63.4 |
31/3/04 |
418.02 |
127.69 |
7.2 |
64 |
*Tughlakabad has been considered as
sensitive area as Batra Hospital is in close vicinity.
F ND-Not detected due to unavoidable reasons.
|
*What is
AQI? |
|