|
|

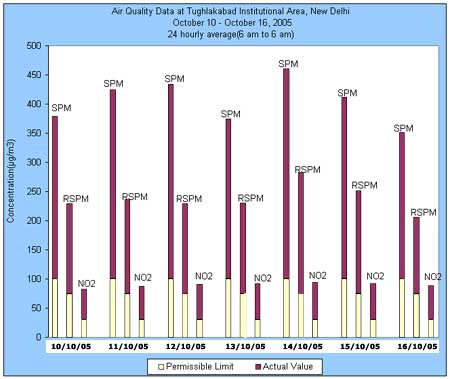
October 10 TO October 16,
2005
Parameters
Date |
Suspended
Particulate matter (mg/m3) |
Respirable
Suspended Particulate
Matter (mg/m3) |
Sulfur
dioxide
(mg/m3) |
Nitrogen
dioxide
(mg/m3) |
Maximum*
Permissible limit
(mg/m3) |
100 |
75 |
30 |
30 |
10/10/05 |
278.52 |
154.30 |
4.23 |
52.07 |
11/10/05 |
324.15 |
160.90 |
4.42 |
56.79 |
12/10/05 |
334.23 |
153.71 |
5.74 |
60.55 |
13/10/05 |
274.48 |
155.45 |
4.97 |
61.65 |
14/10/05 |
360.44 |
208 |
6.65 |
64.64 |
15/10/05 |
311.52 |
175.75 |
6.03 |
61.36 |
16/10/05 |
250.68 |
130.46 |
5.21 |
58.02 |
*Tughlakabad has been considered as sensitive area as Batra hospital is in close vicinity.
NM: Not measured due to unavoidable reasons. |
 |
| |
Actual value |
| |
Permissible limit |
|
*Tughlakabad has been considered
as sensitive area as Batra hospital is in close vicinity.
DATE |
AQI |
DESCRIPTION |
COLOR |
| 10/10/05 |
239.56 |
Very
unhealthy |
|
| 11/10/05 |
262.26 |
Very
unhealthy |
|
| 12/10/05 |
267.28 |
Very
unhealthy |
|
| 13/10/05 |
237.55 |
Very
unhealthy |
|
| 14/10/05 |
280.31 |
Very
unhealthy |
|
| 15/10/05 |
255.98 |
Very
unhealthy |
|
| 16/10/05 |
225.71 |
Very
unhealthy |
|
AQI
INDEX |
| INDEX VALUE |
DESCRIPTION |
COLOUR |
| 0-50 |
Good |
Green |
| 51-100 |
Marginal (Moderate) |
Yellow |
| 101-200 |
Unhealthy (Poor) |
Orange |
| 201-300 |
Very Unhealthy (Very Poor) |
Red |
| 301+ |
Critical |
Purple |
*What is
AQI? |