|
|

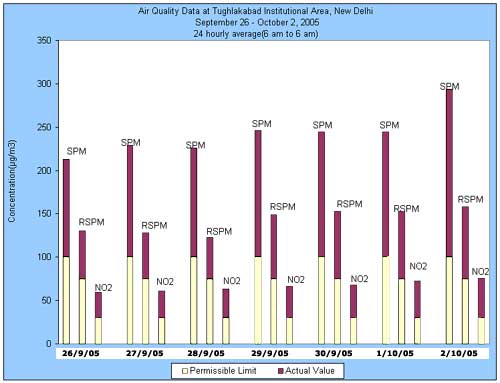
September 26 TO October 02,
2005
Parameters
Date |
Suspended
Particulate matter
(mg/m3) |
Respirable
Suspended Particulate
Matter (mg/m3) |
Sulfur
dioxide
(mg/m3) |
Nitrogen
dioxide
(mg/m3) |
Maximum*
Permissible limit (mg/m3) |
100 |
75 |
30 |
30 |
26/9/05 |
112.79 |
55.10 |
1.27 |
29.57 |
27/9/05 |
129.25 |
52.75 |
2.21 |
31.09 |
28/9/05 |
125.86 |
47.69 |
1.94 |
33.58 |
29/9/05 |
145.70 |
73.42 |
2.07 |
36.29 |
30/9/05 |
144.69 |
77.75 |
2.06 |
38.22 |
1/10/05 |
144.03 |
77.55 |
2.06 |
42.20 |
2/10/05 |
194.03 |
83.28 |
2.69 |
45.34 |
*Tughlakabad has been considered as sensitive area as Batra hospital is in close vicinity.
NM: Not measured due to unavoidable reasons. |
 |
| |
Actual value |
| |
Permissible limit |
|
*Tughlakabad has been considered
as sensitive area as Batra hospital is in close vicinity.
DATE |
AQI |
DESCRIPTION |
COLOR |
| 26/9/05 |
112.79 |
Unhealthy |
|
| 27/9/05 |
129.25 |
Unhealthy |
|
| 28/9/05 |
125.86 |
Unhealthy |
|
| 29/9/05 |
145.70 |
Unhealthy |
|
| 30/9/05 |
144.69 |
Unhealthy |
|
| 1/10/05 |
144.03 |
Unhealthy |
|
| 2/10/05 |
194.03 |
Unhealthy |
|
AQI
INDEX |
| INDEX VALUE |
DESCRIPTION |
COLOUR |
| 0-50 |
Good |
Green |
| 51-100 |
Marginal (Moderate) |
Yellow |
| 101-200 |
Unhealthy (Poor) |
Orange |
| 201-300 |
Very Unhealthy (Very Poor) |
Red |
| 301+ |
Critical |
Purple |
*What is
AQI? |